Viewing Vivid Mosaic Products
When you select a Vivid Mosaic product from the product drop-down, additional imagery options become available in the Imagery panel.
Viewing Vivid Mosaic Basemaps
-
In the Imagery panel, from the Imagery Type drop-down, select the Vivid Mosaics basemap you want to view. After you add an area, Vivid Mosaic imagery will appear in the Imagery panel.
Additionally, Vivid Options will become available in the Imagery panel.
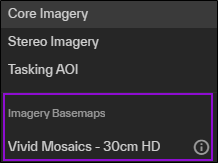
Vivid Mosaic imagery basemaps in the Imagery panel.
Viewing Vivid Mosaic Age
After you add area using a Vivid Mosaics product, you can turn on the Vivid Mosaic age to see what year each imagery product in the Vivid Mosaic was collected.
-
In the Vivid Options section of the Imagery panel, select Show Mosaic Age.
The age of each image displays on the map. Use the Image Age legend at the bottom of the viewport to determine the age of the imagery.
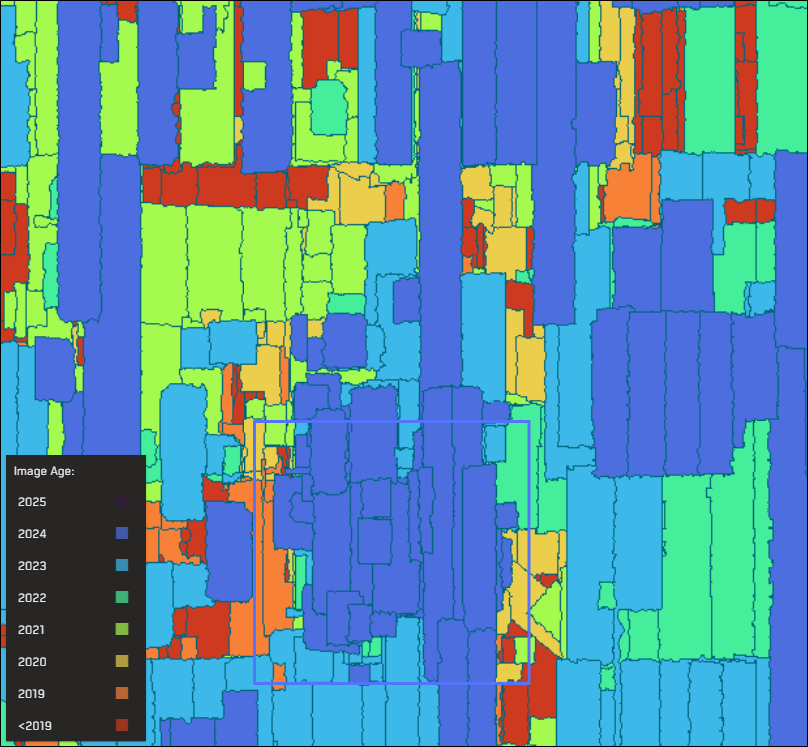
Multiple images make up a Vivid Mosaic. The Image Age legend indicates the year each image was acquired.
-
(Optional) To view more information about a Vivid Mosaics AOI, next to the area you want to view, select the menu
 , then select Show Vivid Age Chart. In the dialog that opens, view the mosaic metrics and a pie chart of the imagery ages by year.
-
Area (km2) Total mosaic area that intersects the AOI
-
Landmass Coverage Area (km2) Area of the landmass that intersects the AOI
-
Landmass Coverage (%) Percentage of the landmass that intersects the AOI
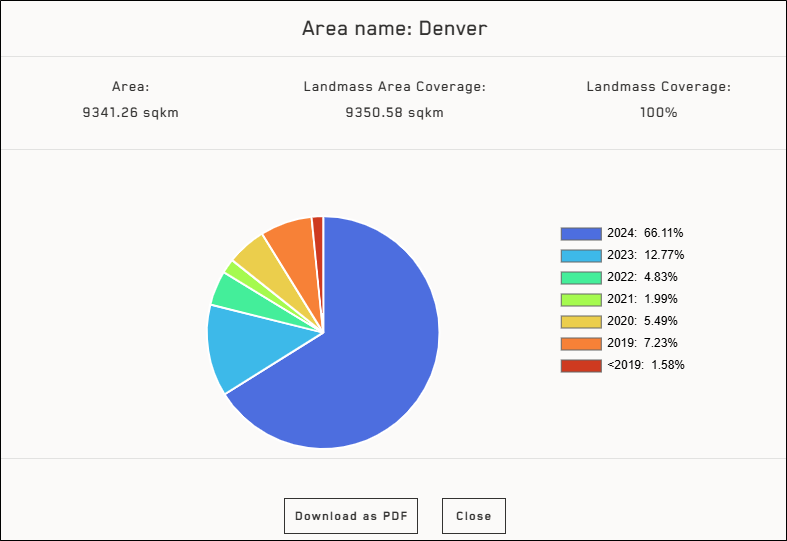
Select Download as PDF to save the information to a file.
-